POPULAR COURSES
Master Programs


Data Analytics Course in Bangalore
Guaranteed 5 interviews & certification from Jainx University.
2000+ Ratings
3000+ Happy Learners
The Data Analytics Course in Bangalore by Apponix is one of the most comprehensive programs designed to meet the growing demand for skilled data analysts. This course provides in-depth knowledge of data analysis, statistical techniques, data visualisation, and business intelligence tools.
Apponix’s Data Analytics training includes hands-on experience with essential tools like SQL, Python, Excel, Tableau, and Power BI. Industry experts curate the course curriculum to ensure that learners gain practical exposure through real-time projects and case studies. With flexible classroom and online batches, experienced trainers, and 100% placement assistance, this Data Analytics Course in Bangalore helps learners become job-ready and build successful careers in top companies.
Data Analyst Training Videos
Skills Covered in Data Analyst Training Course
Data analysis planning
Data analysis monitoring
Elicitation
Collaboration
Tick Managing requirements life cycle
Analyzing business strategies
Definition of business design
Analyzing business requirements
Details about business intelligence
Details about business architecture
Data Cleaning and Preparation
Data Visualization
Statistical Analysis
SQL for Data Analysis
Programming for Analytics
Key Features
You will have access to eleven case studies
You will have access to CBAP exam application assistance
You will have access to eleven quizzes that you can solve after the end of a lesson.
The course curriculum adheres to the strict standards set by BABOK® Guide Version 3.
Delivered by Industry Experts
Professional Resume building
Interview Preparation Session
Interpersonal Skills Training
Interactive Q&A Discussion
Designated Placement Advisor
Certification Guidance
Weekly Practice Assignments
Zero-Interest EMI Option
Classroom & Online Training
Weekdays & Weekend Classes
1 Year Access to Recorded Sessions
Assured Job Placement
Delivered by Industry Experts
Our Alumni Working in Top Companies in the Industry


Course Reviews

Arathi
Data Analyst
I have completed the Data Analyst course at Apponix Technologies. The trainers were excellent and very supportive, making it easier to grasp complex concepts. Thank you for providing such valuable guidance and support throughout the learning process.

Chitra
Data Analyst
I recently completed the Data Analyst course at Apponix Technologies. The trainers were knowledgeable and offered great support throughout the course. Their guidance made complex concepts easy to understand. I appreciate their efforts in helping us build strong analytical skills.

Sanjana
Data Analyst
I took the Data Analyst course at Apponix Technologies, and the experience was fantastic. The trainers were patient and provided thorough explanations, ensuring we understood each topic well. Their dedication truly enhanced my learning journey, making it a rewarding experience.
Placements


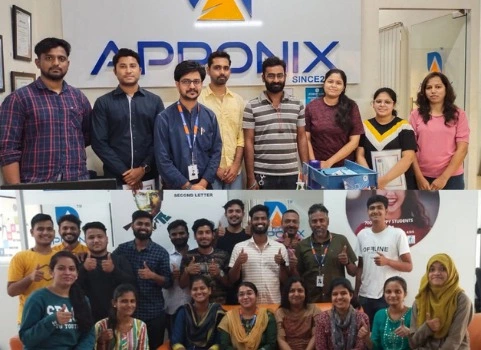
Training Gallery


Training Gallery
Available Training Options
Class room Training
₹
- Interactive Classroom Training Sessions
- 40 Hrs Practical Sessions
- Delivered by Working Professionals
- 1 Year Access to Recorded Sessions
- Placement Assurance
Online Training
₹
- Interactive Live Training Sessions
- Customized training based on client requirement
- Linkedin Learning Premium access for 12 months to all the participants
- Delivered by Industry Experts
Data Analyst Syllabus
Eligibility
To become a successful Data Analyst, you can benefit from the guidance of our expert trainers. The best part about our training program is that all you need is a basic understanding of computers.
Pre-requisites
No prior knowledge or work experience is needed to take this Data Analyst course and learn all aspects of data analysis.
Throughout the course, you will gain all the necessary skills to become a proficient data analyst, from mastering programming languages to using advanced analytical tools.
Data Analyst Training Course Syllabus
Data Analyst Project Life Cycle
Phase 1 - Data Collection
After carefully evaluating the business case in a particular domain, data will be collected surrounding it.
Phase 2 - Data Preparation
Using SQL, a database will be created to store the data collected in the previous step.
Phase 3 - Insights Generation And Dashboard Building
Establish a connection between the database and Tableau/Python/R tools to extract the required data. Generate user-friendly reports according to the business needs and develop the dashboard using Tableau/Power BI.
Projects
Analysis Of Patient Data (Domain: Healthcare)
This project requires learners to analyze the patient data of those suffering from different diseases across various summaries. The facility, chain organizations, and dialysis stations analysis is required to be carried out where the patients are undergoing dialysis. The project also focuses on the payment mode aspect wherein if any discounts or reduction in payments have happened then those are analyzed.
Loan Of Customers (Domain: Banking And Finance)
In this project, learners analyze the loan given by a financial institution to different customers of varied grades and sub-grade levels. The analysis needs to consider the loan disbursement reasons, funded amount, and revolving balance values for every customer in different states and geolocations. The project requires the customers payment modes and the last payment values.
Employee Retention (Domain: HR Analytics)
This HR-related project considers the attrition rate of employees working at an organization at different levels. The attrition rate analysis is done with respect to different factors such as monthly income, last promotion year, job role, and work-life balance of every employee of different departments
Industrial Combustion Energy Use (Domain: Energy)
The project requires learners to analyze the usage of different fuels in different facilities in different applications by finding the MMBTu and GWHt values. The fuels used for different geo-locations and for different primary titles are also taken into consideration while doing analysis.
Flights Delay Analysis (Domain: Aviation)
The primary aim of the project is to determine the different reasons behind the delay of flights of various airlines. The analysis needs to consider the number of flights in operation, the number of flights cancelled, and the statistical summary of week-wise, state-wise, and city-wise flight distributions.
Olist Store Analysis (Domain: ECommerce)
The market for a certain product is analyzed by considering a particular retail outlet which sells these products. The project involves statistical analysis on the payment distribution from different customers with the different modes of transactions across different product categories. The feedback from customers with respect to shipping days and other factors also needs to be considered while carrying out the analysis.
Excel
Introduction
- MS office Versions(similarities and differences)
- Interface(latest available version)
- Row and Columns
- Keyboard shortcuts for easy navigation
- Data Entry(Fill series)
- Find and Select
- Clear Options
- Ctrl+Enter
- Formatting options(Font,Alignment,Clipboard(copy, paste special))
Referencing, Named ranges,Uses,Arithemetic Functions
- Mathematical calculations with Cell referencing(Absolute,Relative,Mixed)
- Functions with Name Range
- Arithmetic functions (SUM,SUMIF,SUMIFS,COUNT,COUNTA,COUNTIFS,
- AVERAGE,AVERAGEIFS,MAX,MAXIFS,MIN,MINIFS)
Logical Functions
- Logical functions:IF,AND,OR,NESTED IFS,NOT,IFERROR
- Usage of Mathematical and Logical functions nested together
Referring data from different tables: Various types of Lookup, Nested IF
- LOOKUP
- VLOOKUP
- NESTED VLOOKUP
- HLOOKUP
- INDEX
- INDEX WITH MATCH FUNCTION
- INDIRECT
- OFFSET
Advanced Functions
- Combination of Arithmatic
- Logical
- Lookup functions
- Data Validation(with Dependent drop down)
Date and Text Functions
- Date Functions: DATE,DAY,MONTH,YEAR,YEARFRAC,DATEDIFF,EOMONTH
- Text Functions:
- TEXT,UPPER,LOWER,PROPER,LEFT,RIGHT,SEARCH,FIND,MID,TTC, Flash Fill
Data Handling::Data cleaning, Data type identification, Remove Duplicates, Formatting and Filtering
- Number Formatting(with shortcuts)
- CTRL+T(Converting into an Excel Table)
- Formatting Table
- Remove Duplicate
- SORT
- Advanced Sort
- FILTER
- Advanced Filter
Data Visualization: Conditional Formatting, Charts
- Conditional formatting (icon sets/Highlighted colour sets/Data bars/custom formatting)
- Charts: Bar,Column,Lines,Scatter,Combo,Gantt,Waterfall,pie
Data Summarization: Pivot Report and Charts
- Pivot Reports:Insert,Interface,CrosstableReports;Filter,Pivot Charts
- Slicers: Add,Connect to multiple reports and charts
- Calculated field, Calculated item
Data Summarization: Dashboard Creation, Tips and Tricks
- Dashboard:Types,Getting reports and charts together, Use of Slicers.
- Design and placement: Formatting of Tables,Charts,Sheets,Proper use of Colours and Shapes
Connecting to Data: Power Query, Pivot, Power Pivot within Excel
- Power Query: Interface, Tabs
- Connecting to data from other excel files, text files, other sources
- Data Cleaning
- Transforming
- Loading Data into Excel Query
Connecting to Data: Power Query, Pivot, Power Pivot within Excel
- Using Loaded queries
- Merge and Append
- Insert Power Pivot
- Similarities and Differences in Pivot and Power Pivot reporting
- Getting data from databases, workbooks, webpages
VBA and Macros
- View Tab
- Add Developer Tab
- Record Macro:Name,Storage
- Record Macro to Format table(Absolute Ref)
- Format table of any size(Relative ref)
- Play macro by button
- shape
- as command(in new tab)
- Editing Macros
- VBA:Introduction to the basics of working with VBA for Excel: Subs, Ranges, Sheets
- Comparing values and conditions
- if statements and select cases
- Repeat processes with For loops and Do While or Do Until Loops
- Communicate with the end-user with message boxes and take user input with input boxes, User Form
MySQL
Introduction to Mysql
- Introduction to Databases
- Introduction to RDBMS
- Explain RDBMS through normalization
- Different types of RDBMS
- Software Installation(MySQL Workbench)
SQL Commands and Data Types
- Types of SQL Commands (DDL,DML,DQL,DCL,TCL) and their applications
- Data Types in SQL (Numeric, Char, Datetime)
DQL & Operators
- SELECT
- LIMIT
- DISTINCT
- WHERE AND
- OR
- IN
- NOT IN
- BETWEEN
- EXIST
- ISNULL
- IS NOT NULL
- Wild Cards
- ORDER BY
Case When Then and Handling NULL Values
- Usage of Case When then to solve logical problems and handling NULL Values (IFNULL, COALESCE)
Group Operations & Aggregate Functions
- Group By
- Having Clause
- COUNT
- SUM
- AVG
- MIN
- MAX
- COUNT String Functions
- Date & Time Function
Constraints
- NOT NULL
- UNIQUE
- CHECK
- DEFAULT
- Primary key
- Foreign Key (Both at column level and table level)
Joins
- Inner
- Left
- Right
- Cross
- Self Joins
- Full outer join
DDL
- Create
- Drop
- Alter
- Rename
- Truncate
- Modify
- Comment
DML & TCL Commands
- DML
- Insert
- Update & Delete
- TCL
- Commit
- Rollback
- Savepoint
- Data Partitioning
Indexes and Views
- Indexes (Different Type of Indexes)
- Views in SQL
Stored Procedures
- Procedure with IN Parameter
- Procedure with OUT parameter
- Procedure with INOUT parameter
Function, Constructs
- User Define Function
- Window Functions
- Rank
- Dense Rank
- Lead
- Lag
- Row_number
Union, Intersect, Sub-query
- Union, Union all
- Intersect
- Sub Queries, Multiple Query
Exception Handling
- Handling Exceptions in a query
- CONTINUE Handler
- EXIT handler
Triggers
- Triggers - Before | After DML Statement
POWER BI
Power BI Introduction and Installation
- Understanding Power BI Background
- Installation of Power BI and check list for perfect installation
- Formatting and Setting prerequisits
- Understanding the difference between Power BI desktop & Power Query
The Power BI user interface, including types of data sources and visualizations
- Getting familiar with the interface BI Query & Desktop
- Understanding type of Visualisation
- Loading data from multiple sources
- Data type and the type of default chart on drag drop.
- Geo location Map integration
Sample dashboard with Animation Visual
- Finanical sample data in Power BI
- Preparing sample dashboard as get started
- Map visual Types and usages in different variation
- Understanding scatter Plot chart with Play axis and the parameters
Power BI artificial intelligence Visual
- Understanding the use of AI in power BI
- AI analysis in power bi using chart
- Q&A chat bot and the use in real life
- Hirarchy tree
Power BI Visualization
- Understanding Column Chart
- Understanding Line Chart
- Implementation of Conditional formating
- Implementation of Formating techniques
Power Query Editor
- Loading data from folder
- Understanding Power Query in detail
- Promote header, Split to limiter, Add columns, append, merge queries etc
Modelling with Power BI
- Loading multiple data from different format
- Understanding modelling (How to create relationship)
- Connection type, Data cardinality, Filter direction
- Making dashboard using new loaded data
Power Query Editor Filter Data
- Power Query Custom Column & Conditional Column
- Manage Parameter
- Introduction to Filter and types of filter
- Trend analysis, Future forecast
Customize the data in Power BI
- Understanding Tool tip with information
- Use and understanding of Drill Down
- Visual interaction and customisation of visual interaction
- Drill through function and usage
- Button triggers
- Bookmark and different use and implementation
- Navigation buttons
Dax Expressions
- Introduction to DAX
- Table Dax, Calculated column, DAX measure and difference
- Eg:- Calendar, Calendar auto, Summarize, Group by etc
- Calculated Column
- Related, Lookup value, switch, Datedif,Rankx,Date functions
- Dax Measure and Quick Measure
- Remove filters, Keep filters, All, Allselected, Time Intelligence Functions,Rollingaverage,YoY, Running total
Custom Visual
- Custom visual and understanding the use of custom
- Loading custom visual, Pinning visual
- Loading to template for future use
- Publishinhg Power Bi
Power BI Service
- Introduction to app.powerbi.com
- Schedule refresh
- Data flow and use power bi from online
- Download data as live in power point and more
Python
Anaconda Installation,Introduction to python,Datatypes,Opearators
- Variables,
- data types(integer,Boolean,Float,List,tuple,string),Opearators in python
Data types Contd,Slicing the data,Inbuilt functions in python
- Dictionaries,Sequencemethods,Concatenate,Repetition,len,min,maxfunctions,Indexposition,Addition and deletion of elements,Reverse,Sorting
Sets,SetTheory,RegularExpressions,Decision making statements
- Sets,re module(findall,search,split,match),if,elifGetting input from user,Identity Operators
Loops,Functions,Lambdafunctions,Modules
- For,Whileloops,Functions,Lambdafunctions,Mathmodule,Calendermodule,Date& time module
Pandas,Numpy,Matplotlib,Seaborn
- Data frame creation using different methods,Using Pandas anlysis on Universities,Salary data sets,Visualization using Matplotlib and Seaborn,Numpy introduction
ChatGPT
Introduction to ChatGPT and AI
- What is ChatGPT?
- The history of ChatGPT
- Applications of ChatGPT
- ChatGPT vs other chatbot platforms
- Industries using ChatGPT
- The benefits and limitations of ChatGPT
- Future developments in ChatGPT technology
- Ethical considerations related to ChatGPT and AI
Types of AI and Chatgpt architecture
- What is AI?
- Types of AI
- What is Machine Learning?
- Neural Networks
- Deep Learning
- Natural Language Processing (NLP)
- Computer Vision
- Robotics and AI
ChatGPT Functionalities and Applications
- How does ChatGPT work?
- ChatGPT Functionalities
- Drafting emails and professional communication
- Automating content creation
- Resume and Cover letter creation
- Research and information gathering
- Brainstorming ideas and creative problem solving
- Best Practices for Using ChatGPT
ChatGPT Prompt Engineering
- What is Prompt Engineering?
- Types of Prompts
- Crafting Effective Prompts
- Using ChatGPT to generate prompt
Call Us On
+91-80505-80888
Data Analyst Training Industry Project
Project 1
Sales Data Analysis
In this project, you will analyze a dataset containing sales records to identify trends, calculate key performance indicators (KPIs), and provide actionable insights. This involves using Excel and SQL to clean, manipulate, and visualize the data effectively.
Project 2
Customer Segmentation
You will work on a project that involves clustering customer data using Python and machine learning techniques. The goal is to identify distinct customer segments based on purchasing behavior, enabling targeted marketing strategies and personalized customer experiences.
Project 3
Interactive Data Dashboard
This project focuses on creating an interactive dashboard using Tableau or Power BI. You will integrate various data sources and design visualizations that allow stakeholders to explore data insights easily, enhancing decision-making processes within a business context.
Our Top Instructors

Mr. Sheikh
About the Trainer
He is a working professional with over a decade of experience in Data Analytics. Currently, he is associated with a reputed MNC, serving as a Senior Platform Engineer.
Over the years, he has been a preferred Data Analytics trainer at Apponix Academy, where he has successfully trained more than 500 students. Known for his deep subject expertise, he effectively teaches practical analytics concepts, including configuration management tools.
Professional Experience & Technical Expertise:
- Extensive Experience: Over 10 years in analytics, currently working as a Senior Platform Engineer in a top MNC.
- Data Pipeline & BI Solutions: Skilled in building scalable data pipelines and delivering business intelligence solutions.
- Analytics Expertise: Proficient in Web, Social Media, Operational, Financial, Risk, and Health Analytics.
- Project Lifecycle Management: Experienced in requirement elicitation, stakeholder collaboration, and end-to-end analytics implementation.
Student Success & Career Support:
He has trained over 1000 students with an outstanding average rating of 4.8. His career support includes:
- Resume Building: Crafting data-focused resumes that stand out to employers.
- Interview Preparation: Conducting mock interviews and sharing real-world insights.
- Job Placement Assistance: Providing strategies and guidance to land roles in data analytics.

Harsha
Education:
I hold a degree from Dayananda Sagar, where I gained essential knowledge in data analytics and related technologies.
Professional Experience:
With over 10 years of experience working in various MNCs, I am currently a Senior Data Analyst at Mindtree, focusing on extracting insights from data to drive business decisions.
Technical Expertise:
- Business & Web Analytics: Skilled in Web, Social Media, Operational, Financial, and Risk Analytics to drive strategic insights and business growth.
- Healthcare Analytics: Applying data to enhance health outcomes and improve operational efficiency in healthcare settings.
- Data Planning & Monitoring: Expertise in planning, executing, and continuously monitoring data analysis processes for accuracy and impact.
- Requirements Management: Proficient in eliciting requirements, collaborating with stakeholders, and managing the full lifecycle of analytics projects.
Student Success & Career Support:
- Trained over 1000 students at Apponix Academy with a 4.8 average rating, offering hands-on, industry-relevant analytics education.
- Supported career growth through resume building, mock interviews, and personalized job placement assistance.

Maimuneesa Kazi
Education:
I graduated from Karnataka University, where I developed a solid foundation in data analytics and business intelligence.
Professional Experience:
With over 10 years of experience across various MNCs, I am currently a Senior Data Analyst at Accenture, specializing in transforming data into actionable insights.
Technical Expertise:
- Expert in Predictive, Descriptive, and Prescriptive Analytics to drive informed business decisions using data-driven insights.
- Skilled in Data Mining and Machine Learning to uncover hidden patterns and automate learning processes from historical data.
- Strong ability to analyze business requirements and translate them into effective data solutions.
- Proficient in Business Intelligence and Business Architecture for aligning analytics with strategic goals and operational efficiency.
Student Success & Career Support:
- Trained over 1000 students at Apponix Academy with an average rating of 4.8, focusing on practical, job-oriented analytics skills.
- Provided personalized resume building and interview preparation to boost student confidence and employability.
- Offered structured job placement support, helping students successfully transition into data analytics careers.

Suhas
Education:
I hold a degree from Global University, where I gained essential knowledge in data analytics and its applications.
Professional Experience:
With over 9 years of experience in various MNCs, I am currently a Senior Data Analyst at Intel, specializing in leveraging data to drive business success.
Technical Expertise:
- Big Data & Database Management: Skilled in handling large datasets using technologies like Hadoop, and managing SQL/NoSQL databases for optimal performance.
- ETL & Data Warehousing: Proficient in building robust ETL pipelines and designing data warehouses for efficient data storage and access.
- Business Intelligence & Analysis: Experienced in using BI tools to derive actionable insights and plan/monitor analysis for strategic decisions.
- Requirement Gathering: Adept at eliciting and translating business needs into data-driven solutions.
Student Success & Career Support:
- Trained over 1000 students at Apponix Academy with an outstanding average rating of 4.8, delivering hands-on, industry-relevant instruction.
- Provided personalized career support including resume building and mock interview sessions tailored for data analytics roles.
- Guided students through successful job placements with targeted strategies and mentorship.

Moksha
Education:
I graduated from Presidency University, where I laid the foundation for my expertise in data analytics.
Professional Experience:
With over 15 years of experience in the field, I currently serve as a Senior Data Analyst at TCS, working with various MNCs to deliver data-driven solutions.
Technical Skills:
- Data Strategy & Lifecycle Management: Skilled in planning, monitoring, and managing the full lifecycle of data analysis and business requirements.
- Business Intelligence & Analytics: Proficient in descriptive, predictive, and prescriptive analytics to drive strategic decision-making.
- Data Collection, Cleaning & Visualization: Experienced in collecting, preparing, and presenting data using effective visual tools for clear insights.
- Business Analysis & Architecture: Capable of aligning business goals with data solutions through structured analysis and architectural planning.
- Collaboration & Stakeholder Engagement: Strong in requirement elicitation and team collaboration to ensure data solutions meet organizational needs.
Student Success & Career Support:
- Trained over 1300 students at Apponix Academy with an exceptional 4.9 average rating, delivering practical, industry-aligned analytics training.
- Offered comprehensive career support including resume building, interview preparation, and job placement assistance, helping students secure roles in data analytics.
Overview of Data Analytics Course in Bangalore
Data is changing how businesses are operated - and those who can interpret and avail data are in high demand. Our data analytics course in Bangalore is designed to help you master essential tools and techniques used by top organizations. Whether you are a technical professional or a middle-tier manager, aiming to elevate your earning potential, this course provides a clear, path to the hands to elevate your career. From foundational concepts to advanced analytics tools such as SQL, Python and Power BI, we prepare you to make confidently influential data-powered decisions.
This comprehensive course combines hands-on learning with expert-led sessions, ensuring you gain practical experience in real-world applications. With a curriculum tailored to industry standards, you’ll be well-prepared to step into high-paying data roles upon completion.
Benefits of Data Analytics Course in Bangalore
Enrolling in our Data Analytics Course in Bangalore offers advantages that can significantly boost your career:
- Career Growth Opportunities: Equip yourself with in-demand skills that open doors to lucrative roles in the tech and corporate sectors.
- Enhanced Decision-Making Skills: Learn how to use data to make smarter, data-driven business decisions.
- Hands-On Practical Experience: Gain confidence by working on real-time projects and case studies.
- Versatile Skill Set: Master tools like SQL, Python, Excel, Power BI, and Tableau—skills applicable across industries.
- Increased Earning Potential: Data analytics professionals are among the top-paid in the job market.
- Flexible Learning: Choose from online or classroom sessions that fit your schedule without compromising quality.
Career Opportunities After Data Analytics Course
By completing our data analytics course in Bangalore, doors open for a wide range of high-ral roles in data domains, such as:
- Data Analyst: Interpret and analyze data trends to help businesses make informed decisions.
- Business analysts: Bridge the gap between business objectives and data-driven strategies.
- SQL Developer: Specialization in the management and adaptation of the database using SQL.
- Power BI/Tableau Developer: Design an interactive dashboard for visual storytelling and reporting.
- Data scientist (entry-level): aid in creating future models and achieving actionable insights.
Data Analyst Training Course
Who can take Data Analyst Training?
- Fresh graduates or non-graduates.
- Diploma holders with basic computer knowledge.
- BPO, Call center, or administrative professionals.
- Anyone interested in data analysis and data-driven decision-making.
Which course is best for Data Analysis?
- Data Analyst Bootcamp, Thinkful Data Analyst Bootcamp, IBM Data Analyst Professional Certificate, etc.
Data Analyst
Are the online classes and self-paced learning materials available throughout the year?
Yes, apart from accessing online and self-paced learning course materials, you will also have access to CBAP Exam Prep classes throughout the year!
Do I need experience in the relevant areas to be eligible for this course?
Yes, you would need to have at least 900 + hours in 4 – 6 relevant areas before you apply for this course.