Apponix Technologies
Master Programs
Career Career Career Career

Tableau Certification Bootcamp Training Course by Industry Working Professionals


Tableau and Data Visualization Videos


Skills Covered in Tableau and Data Visualization

Tick
The basics about Tableau statistics
Tick
How to build interactive dashboards using Tableau
Tick
Dashboard objects
Tick
Arithmetic as well as logical calculations of LODs
Tick
Techniques for clustered forecasting
Tick
Techniques for customized geo-coding as well as radial selections
Tick
All about special field types
Tick
Details about fixed LOD
Tick
Details about parameters in Tableau
Tick
Data loading techniques from Excel spreadsheets.

Tableau and Data Visualization Training Key Features

You will be able to sit in two mock exams
You will have access to 4 real-world projects.
You will have lifetime access to self-paced learning course content
You will have access to a dedicated project mentor or mentoring sessions
The course will be completed within 56 hours and will mostly be in an applied learning format

Our Alumni Working in Tableau and Data Visualization

Google-Analytics
Google-Analytics
Google-Analytics
Google-Analytics
Google-Analytics
Google-Analytics
Google-Analytics
Google-Analytics
Google-Analytics
Google-Analytics
Google-Analytics
Google-Analytics
Google-Analytics
Google-Analytics
Google-Analytics
Google-Analytics
Google-Analytics
Google-Analytics
Google-Analytics
Google-Analytics
Google-Analytics
Google-Analytics
Google-Analytics
Google-Analytics
Google-Analytics
Google-Analytics
Google-Analytics
Google-Analytics
Google-Analytics
Google-Analytics
Google-Analytics
Google-Analytics
Google-Analytics
Google-Analytics
Google-Analytics
Google-Analytics

Tableau and Data Visualization Course Reviews


Our Recent Placements

Classroom Training

Classroom Training

Classroom
Classroom
Classroom
Classroom
Classroom
Classroom
Classroom
Classroom
Classroom

Available Training Options

Online Training

  • The online Bootcamp will span for 90 days and it will come with flexible class timings.
  • You will have lifetime access to live class recordings as well as e-learning course content for seamless self-paced learning.
  • Round-the-clock access to learner’s assistance and support teams.
Enroll Now

Tableau and Data Visualization Training Syllabus

Prerequisites

This course is perfect for people who want to hone their data analytical skills.Data scientists, testers and IT developers can pursue this course. Business intelligence and reporting experts too can benefit from this course. The best part, there are no prerequisites for this course.

Tableau and Data Visualization Course Syllabus

Tableau and Data Visualization
  • The first lessons will be on the introduction of Tableau.
  •  The second lesson will be based on how to get started with Tableau.
  •  The third lesson will cover the core of Tableau.
  •  The fourth lesson will cover the facts of creating a chart using Tableau.
  •  The fifth lesson will cover the facts on how one can work with metadata.
  •  The sixth lesson will cover the facts of using Tableau filters.
  •  The seventh lesson will teach students how they can apply analytics on a worksheet.
  • The eighth lesson will cover the basics of Tableau Dashboards.
  •  The ninth lesson will teach students how they can modify data connections.
  •  The tenth lesson will cover LOD or better known as ‘Level of Detail’.
Call Us On

+91-8050580888

Contact Us


Our Top Instructors

Overview of Tableau and Data Visualization Training Course

  • Our Tableau and Data Visualization certification training is designed to equip professionals with the skills to visualize and analyze data using Tableau software. The course covers a wide range of topics including data connections, data blending, calculations, and dashboard creation. We provide training through experienced trainers who have real-world industry experience.
  • During the training, participants will learn how to create visually appealing dashboards and gain insights into data, which is vital for making informed business decisions. Our Tableau and Data Visualization certification training provides hands-on experience in working with Tableau software, giving participants a competitive edge in the job market.
  • Upon completion of the course, participants will be able to create and publish interactive dashboards, understand complex data relationships, and perform data analysis with ease. The certification received at the end of the course is recognized globally, adding value to the participants' professional profiles.

Benefits of learning Tableau and Data Visualization

  • Here are 5 benefits of taking Tableau and Data Visualization certification training:
  • Improved Data Visualization Skills: The Tableau and Data Visualization certification training equips you with the knowledge and skills to create compelling visualizations and dashboards to communicate data insights effectively.
  • Increased Employability: The demand for professionals with Tableau and Data Visualization skills is on the rise. By getting certified in these technologies, you increase your chances of being hired by top companies.
  • Enhanced Data Analytics Skills: Tableau and Data Visualization certification training provides you with a comprehensive understanding of data analytics and how to leverage it for business decision-making.
  • Competitive Advantage: With a Tableau and Data Visualization certification, you have a competitive advantage over your peers who lack this certification. This can help you get promotions and better job opportunities.
  • Flexibility: Tableau and Data Visualization skills are transferable across industries, making it a versatile certification to have. You can work in industries such as healthcare, finance, retail, and more.


Related job roles

  • Business Intelligence Analyst
  • Business Analyst
  • Tableau Consultant
  • Data Analyst
  • Business Intelligence Developer
  • Business Intelligence Manager.
     

2000+ Ratings

3000+ Learners

Tableau and Data Visualization

Are the online classes live sessions or pre-recorded sessions?

In case you are willing to go forward with self-paced learning then you will have access to pre-recorded videos. In case you are willing to go forward with online classes then the sessions will be live.

What is the role of a Tableau developer?

The role of a Tableau developer is to create solutions that a business may need to progress and achieve its goals. A Tableau developer will also be a master of data visualization.

Career

Tableau and Data Visualization

Are there any benefits of learning Tableau?

Tableau is an advanced-level analytical and business intelligence tool that has a lot of applications among data analysts and data scientists. Tableau allows professionals to analyze large volumes of data and make sense of the same in no time. Hence, if you want to be a data analyst or data scientist, you need to learn Tableau.

Will the benefits of online classes be the same as self-paced learning?

Yes, the benefits of self-paced learning and online classes will be the same as in both cases; the lectures will be delivered by industry experts who have more than fifteen years’ worth of experience.

Certifications & Exam related to Tableau and Data Visualization

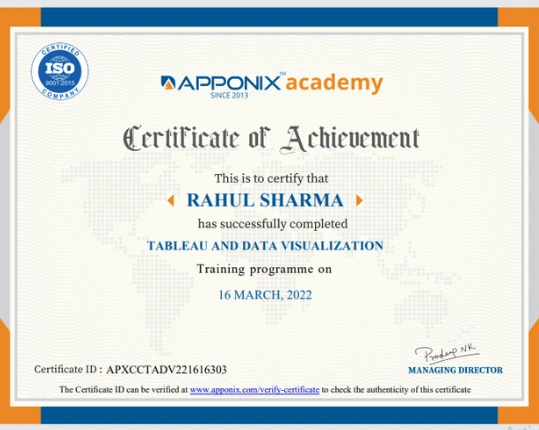
You will be provided with an industry-recognized course completion certificate after the curriculum of the course is covered by our trainers.


It is a dedicated team of experts who are proficient in the subject taught at a particular course offered here at Simplilearn.

Yes, you can revisit the recorded sessions in case you miss an online class.

Certification

Career after Tableau and Data Visualization

  • A career in Tableau and Data Visualization can be both challenging and rewarding. Tableau is a popular data visualization software that allows users to create interactive and visually appealing dashboards, reports, and charts. With the increasing demand for data-driven decision-making, the importance of data visualization skills has also grown.
  • As a Tableau and Data Visualization professional, your primary responsibility is to help organizations understand their data better by creating intuitive visualizations. You will need to be proficient in working with data and possess excellent analytical and problem-solving skills.
  • The demand for Tableau and Data Visualization professionals is on the rise, as more and more organizations recognize the importance of data visualization in making critical business decisions. The job roles that require Tableau and Data Visualization skills include Data Analyst, Business Intelligence Analyst, Data Scientist, and Visualization Designer, among others.
  • With the increasing demand for Tableau and Data Visualization professionals, the job prospects in this field are excellent. According to industry reports, the demand for Tableau and Data Visualization professionals is expected to grow significantly in the coming years, creating ample job opportunities.

Career

Frequently Asked Questions

You can unlock the industry-recognized certificate from Simplilearn only in the following cases – 

  • In case you chose to go ahead with our online classroom sessions then you would need to be present for a complete batch of the training and submit a project as well.
  • In case, you chose to go ahead with self-paced learning then you would need to complete at least righty-give percent of the course curriculum and submit a complete project.

The exam fee for the actual Tableau Desktop Certified Associate exam is USD 250.


The certificate will be valid for two years.


The actual Tableau Desktop Certified Associate exam will have thirty-six multiple-choice questions that you would need to answer in two hours. In order to be eligible for the certificate, you would need to pass the exam with more than 75% marks.


Yes, you will be able to sit in one practice test for all participants of this course that allows them to prepare for the real certification exam.


Tableau is a data visualization software tool that has found a firm foothold in the business intelligence sector.


Yes, a novice too can take this course and learn Tableau as the curriculum followed at Simplilearn covers all the basics of Tableau.


The trainer(s) for this course are industry experts who will have at least a decade’s worth of experience in the field. Furthermore, the trainer selection process here at Simplilearn is very strict – this allows us to offer you quality assured sessions.


All courses available online  & Offline classes are available in Bangalore, Pune, Chennai only.
 

It is mentioned under the training options. Online, Offline & self paced learning course fees differs.
 

Course duration is 2 months or 60 Hrs Usually daily 2 hrs.

Yes, We provide course completion certificate on web design & development. apart from this there is 1 more certificate called as “ Apponix Certified Professional in Tableau and Data Visualization”
If you score more than 80% in the exam you will be awarded as “Apponix Certified Professional”

Yes, we provide you the assured placement. we have a dedicated team for placement assistance.

 All our trainers are working professional having more than 6 years of relevant industry experience.

Related Popular Training Courses

Tableau Certification Course career in 2025

  • Tableau and Data Visualization have become an integral part of the modern business world, making it imperative for professionals to master these tools. To achieve this, one must undergo Tableau and Data Visualization Certification Training. This training provides participants with an in-depth understanding of how to use Tableau and other data visualization tools to gather, analyze and visualize data, making it easier to communicate insights and make data-driven decisions.
  • The advantages of taking Tableau and Data Visualization Certification Training are numerous. Firstly, it enables you to stand out in the job market by showcasing your expertise in Tableau and Data Visualization. Secondly, it improves your chances of getting hired by top companies that rely heavily on data. Additionally, it equips you with the skills needed to create visually compelling dashboards that can help businesses make data-driven decisions.

  • Tableau and Data Visualization courses are popular for many reasons. Firstly, Tableau and other data visualization tools are highly sought after by businesses of all sizes and in all industries. Secondly, the rise of big data has made it imperative for businesses to have professionals who can make sense of data and present insights clearly and concisely. As a result, there is a high demand for Tableau and Data Visualization professionals, making these courses more popular than ever.
  • Job opportunities for Tableau and Data Visualization professionals are expected to grow rapidly in 2025 and beyond. With businesses relying more and more on data to make informed decisions, there is an ever-increasing demand for professionals who can make sense of data and present insights clearly and compellingly. The skills acquired through Tableau and Data Visualization Certification Training are highly valued in today's job market, with a wide range of career paths available such as Data Analyst, Business Analyst, Data Scientist, and Data Visualization Specialist.

In conclusion, Tableau and Data Visualization Certification Training are essential for anyone looking to gain a competitive edge in the modern job market. It equips participants with the skills needed to create visually compelling dashboards, analyze and interpret data, and make data-driven decisions. With the high demand for Tableau and Data Visualization professionals, taking this course opens up numerous career opportunities in the years to come.

What is the scope of a Tableau expert in India?

The career scope for a Tableau expert in India is quite promising to state the least. As per the information shared by Tableau experts currently working in India at popular career websites like Indeed, skilled Tableau personnel can earn around INR 20 lakhs per year. A beginner in this field can expect to earn about INR 8, 55015 per year.

Career
X

Tableau and Data Visualization Related Articles

TOP